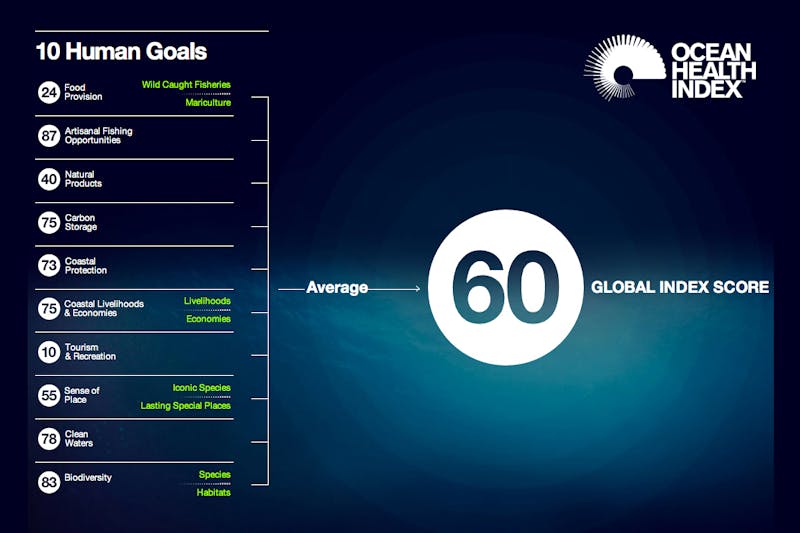
Editor’s note: For the past five years, the team behind the global ocean health report card, Ocean Health Index (OHI), have been trying to figure out how to reproduce their science faster. Assessing the scores on everything from biodiversity to tourism for 220 coastal nations and territories is a massive undertaking — and it involves synthesizing data from nearly 100 sources.
OHI scientists — including several from Conservation International, the index’s co-developer — knew there was a way to do “better science in less time.” A new paper in the journal Nature details how they were able to do just that: By borrowing philosophies, tools and workflows primarily created for software development, OHI scientists fundamentally changed their approach to science. Conservation News sat down with the study’s lead author, Ocean Health Index project scientist Julia Stewart Lowndes, to discuss the key to this new approach: open science.
Question: How is open science the key to better science, faster?
Answer: Open science is both a philosophy and a practice. The philosophy of open science is that sharing your work is beneficial to you and everyone else, and it’s about lowering barriers to enable you to share your work. The practice of open science revolves around the technical details of how to actually share your work — the potential for scientists to share the motivations, data, and methods behind their studies, including code, figures, results and any publications that come out of it.
Traditionally, the philosophy of open science was more concept than reality. But over the last few years, its acceptance has accelerated, in large part because of new software tools that enable the sharing and replication of data. Within the Ocean Health Index team, for example, we use collaborative online tools that make sharing information with each much more efficient. Think of it like the online file-sharing tool Dropbox: You can collaborate with your team on a specific project in the “cloud,” but you can also share your work with those outside your team so they can make use of it, too. This enables open science to be done very easily.
Graphics from Ocean Health Index website. multimedia.
Q: Open science depends on data being two things: transparent and reproducible. What does that look like?
A: It means the data is available to you, [and] it’s clear where it came from and how it was collected (the metadata). For open science to work, whatever methods you use for the data you’re sharing, such as the code or the steps that you take, are also open. The value of having data and methods open is that everybody has faster access to ideas and methods that they themselves can work on — and that will drive science forward faster.
The idea of reusing data is a big part of open science. While data is often collected with a certain purpose in mind, but that doesn’t mean that it can’t be recycled, reused or upcycled. Synthesis science has been relying on existing data for a long time — and it makes use of this data to help understand broader themes, especially in ecology and conservation. Take ecological studies, for example: Many of them are place-based and provide a snapshot of what’s happening in a specific area at a specific time. If there are hundreds of small placed-based studies — snapshots — you can synthesize that data and look at the bigger picture, such as the effects of climate change on a particular country.
Q: Can you give an example of open science we use every day?
A: Consider the weather app on your phone. The National Weather service collects a ton of weather data that they post online for free. Technically, anyone could take that data and work with it. The weather app synthesizes and then distills all of that data down to a few numbers that inform your day: what the day’s temperature will be, what the chance of rain or snow is, if it will be windy. That’s open science at work.
Q: How does OHI use open science?
A: The Ocean Health Index was founded on the idea of reproducibility because of two central reasons: We planned to repeat global assessments annually to track change through time, and we wanted methods to be repurposed in different contexts so we could perform country-specific and topic-specific analyses.
As a team, we’ve had to learn new tools to enable ocean science in our work. Coding and version control — a program that organizes your files without the hassle of remembering which filename is the latest version — are our bread and butter, the tools we use constantly. But what makes them unbelievably more powerful are systems like Github and RStudio that make our coding open and distributable.
I think of it like the printing press all over again: Instead of everybody working on their own, doing things by hand, now we have a way to reproduce things and distribute them efficiently.
Think of a company like Twitter. Employees aren’t emailing data files back and forth, they’re using this collaborative software because it was built specifically to work with big teams and big data sets that are always changing and need to be analyzed. Using these tools not only makes analysis easier, it enables easier, faster communication — and having communication so woven into the analysis lowers the barrier for communication as well.
Why wouldn’t we use that for science too?
Further reading
Julia Stewart Lowndes is the Ocean Health Index project scientist at the National Center for Ecological Analysis & Synthesis at University of California, Santa Barbara.
Lindsay Mosher is the senior coordinator for the governance and policy group within CI’s Center for Oceans. Want to read more stories like this? Sign up for email updates. Also, please consider supporting our critical work.
